August 27th marked the release date of state assessment results across the state. These annual tests, given each spring, are required by state and federal law. We use them as one tool to help determine a student's progress in meeting expectations on Minnesota state standards for reading, math, and science. Reading and Math assessments are given to students in grades 3-5, and Science is only given to students in grade 5.
So how did our school and students do? At Sibley 73.1% of our students were proficient in math, 64.3% in reading, and 60.9% in Science.
When comparing Sibley against the state, the state was 60% proficient in math, 57.6% in reading, and 52.4% in Science.Yes, Sibley exceeded the proficiency levels on all three assessments when compared to the state. When referring to "the state," realize that this is a comparison to ALL students across Minnesota enrolled in grades 3-5 last school year.
Some things to keep in mind when analyzing "end of year," or summative tests. Take them for what they are worth. They are not excuses, but facts to recognize when reviewing any school's assessment data in our state.
- 2013 was the first year students took new forms of the reading test based on a much more challenging set of reading standards.
- All three tests are given to our students online.
- The math test in 2012 allowed students to take the test three times and use their highest score.
- This was not the case in 2013 where students were allowed one opportunity in the spring.
Although proficiency results are one way to determine instructional effectiveness, trend data is much more valuable. Trend data becomes a better way for determining progress, deficiencies needing attention, and validation for growth being made by any school.
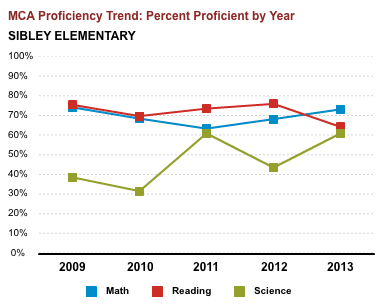 In reading since 2009, Sibley shows the following trend in proficiency: 75.4%, 69.7%, 73.5%, 76%, and 64.3%.

In math since 2009, Sibley shows the following trend in proficiency: 74.2%, 68.5%, 63.4%, 68.2%, and 73.1%.
Did the change in the statewide reading assessment and standards impact things? Yes, and this can be seen statewide. However, increasing the level of rigor in our standards is a good thing. Sibley's math trend is certainly something to follow!
No comments:
Post a Comment